Wherein I list some (mostly) recent happenings, ramble a bit, and provide links, in an order roughly determined by importance and relevance to particle physics.
- Doing the rounds lately has been a new mechanism for leptogenesis: (post-inflationary) Higgs relaxation leptogenesis. APS has a synopsis and Scientific American has a story (never let difficult physics stop a title containing both "Higgs" and "antimatter"). Kusenko, Pearce and Yang achieve the observed matter-antimatter asymmetry using this mechanism in only the minimal Type I see-saw model. The Type I see-saw is a very nice model for neutrino masses, and it can explain leptogenesis via the Fukugita-Yanagida mechanism (1986), but it is not possible to do both without ceding naturalness. For me, this provokes an interesting question: is there any way of doing natural leptogenesis in the Type I see-saw without adding new particles? The only ways I am aware of are resonant leptogenesis and neutrino oscillations. This could be another (and would be a nice selling point for the mechanism) if it can work with $M_N\lesssim 10^7$ GeV... but this requires further thought and investigation; in the examples they give (Figure 2) the right-handed neutrinos are much heavier than this requirement.
- Tom Kibble's recollections on the history of electroweak symmetry breaking are online. I don't think there is anything in there that is particularly new, but it is a nice short document written at an accessible level. Here is an excerpt on the three-year gap between the Higgs mechanism and the electroweak theory:
The 1964 papers [on avoiding the Goldstone theorem] from the three groups attracted very little attention at the time. Talks on the subject were often greeted with scepticism. By the end of that year, the mechanism was known, and Glashow’s (and Salam and Ward’s) SU(2)×U(1) model was known. But, surprisingly perhaps, it still took three more years for anyone to put the two together. This may have been in part at least because many of us were still thinking primarily of a gauge theory of strong interactions, not weak... A unified gauge theory of weak and electromagnetic interactions of leptons was first proposed by Weinberg later that year. Essentially the same model was presented independently by Salam in lectures he gave at Imperial College in the autumn of 1967 — he called it the electroweak theory... Weinberg and Salam both speculated that their theory was renormalizable, but they could not prove it... Renormalizability was finally proved by a young student, Gerard ’t Hooft, in 1971, a real tour de force using methods developed by his supervisor, Martinus Veltman.
- I'm seeing a bunch of articles linking mass extinctions to disk dark matter again this week. The origin appears to be a press release from NYU on a paper by a Professor of Biology who appears to be an expert in extinction events. You can read it in full for free here. The paper, which is in a monthly notices journal, seems to me to be largely a review, perhaps with the new suggestion of linking the work of Abbas-Abbas on clumpy dark matter capture causing large-scale volcanism with the Randall-Reece disk dark matter scenario to explain the ~35 Myr period in mass-extinction events. For that reason it is disappointing to not see any reference to those authors in the press release or the related articles circling around. Maybe as a consolation, given the buzz around those articles, it is clear that Randall's new book should sell by title alone!
- A new arXiv preprint shows that in elliptical galaxies, the central stellar velocity dispersion (a surrogate for the central black hole mass) is more tightly correlated to the total gravitating mass of the galaxy rather than the stellar mass, connecting central black holes of elliptical galaxies with their dark matter halo.
- A separate preprint has observed nearly-spherical streams of ionized gas winds coming from an active central black hole. Bad Astronomy has a nice article about it. The winds transfer energy into the galaxy well beyond the gravitational influence of the black hole, affecting the galaxy's evolution.
- I learned this week that it is actually fairly easy to extract data from a vector plot. This is a common task for the phenomenologist so I will explain two examples below for reference, since I haven't seen it written anywhere in detail; skip this point if you're not interested.
Usually, if I need to scrape a plot (often exclusion curves) I just use WebPlotDigitizer, however there are some plots with many points or indiscernible lines which are not amenable to that method. For example, the BaBar limit on dark photons is a nightmare:
But it is a vector plot, so in principle it should be possible to extract the information on how to draw the curve. Here is one way...
First save the page of the .pdf as an .svg file (I used inkscape). When you open the .svg file in a text editor you will find some intuitive syntax describing how to draw the plot. We want to pick out the BaBar line, so I looked for an occurrence of stroke:#000000 (a black line) associated with a list of numbers. If you do this yourself you will find those numbers in the following context inside a "path" element:
d="m 146.558,372.935 0.639,-122.326 1.668,4.96 1.625,1.169 ...
According to the syntax, in general a path element contains a d="(path data)" attribute, where the ‘d’ attribute contains the moveto, line, curve (both cubic and quadratic Béziers), arc and closepath instructions. In the above case we have a lower case m which indicates relative moveto's which will draw the line of interest. To get the points then we just have to transcribe the list into our favourite format and write a for-do loop (or similar) to obtain absolute positions.
In Mathematica, this can be done by replacing spaces with "},{" and adding opening and closing brackets to obtain the list:
pts={{146.558, 372.935},{0.639, -122.326},{1.668, 4.96},{1.625, 1.169},...
Then the for-do loop is just
Lpts=Length[pts];
relpts=pts;
Do[
relpts[[i]]=relpts[[i-1]]+relpts[[i]]
,{i,2,Lpts}]
Which upon plotting looks like the following:
Now all you have to do is rescale your axes!
Another example is Fig. 3 of the recent BaBar long-lived particle search:
After saving as a .svg, you will see that the plots are made up of many (many) points. Say you wanted all the cyan points. Each point appears as its own path object in the file like so:
...
style="fill:#00ffff;fill-opacity:1;fill-rule:evenodd;stroke:none" /><path
d="m 1087.05,7047.46 c 0,1.66 -1.35,3 -3.01,3 -1.65,0 -3,-1.34 -3,-3 0,-1.66 1.35,-3 3,-3 1.66,0 3.01,1.34 3.01,3"
id="path16732"
style="fill:#00ffff;fill-opacity:1;fill-rule:evenodd;stroke:none" /><path
d="m 1085.84,7048.66 c 0,1.66 -1.34,3 -3,3 -1.65,0 -3,-1.34 -3,-3 0,-1.65 1.35,-3 3,-3 1.66,0 3,1.35 3,3"
...
All the points you want are the coordinates after the m. So you just need to get them somehow. There are no doubt multiple approaches to this. In bash you could grep or awk or sed your way there. For this example I used the command
$ sed -n '/fill:#00ffff/{n;p;}' BaBar1502.svg > cyanpts.dat
to print to file all the lines after a line with a match for fill:#00ffff. If you paste that document into a spreadsheet program you can then pick off the numbers of interest into columns.
- In video media:
- A promo video from CERN with some nice shots of the LHC experiment: The LHC is preparing to start. [2 minutes]
- Here is a drone flying over the ALICE detector. [3 minutes]
- I missed this talk by Dan Hooper from a few weeks ago. Some talk on the central excess is at 28-46 mins. There is also a fun anecdote about astrophysicist Troy Porter. [1 hour]
- Katie Mack talking about Mars plumes, the star that passed through the Oort Cloud 70,000 years ago, the Europa Clipper mission, and Ceres on breakfast radio. Begins at 2:13. [9 minutes]
- SmarterEveryday is starting a space series with a personal touch. In the first video astronaut Don Pettit shows how he turns off the streetlight at the end of his driveway with a laser so that he can better view the night sky. [4 minutes]
- Mary Somerville, Alan Turing, and Stephen Hawking autographs in The Royal Society Charter Book at Objectivity. [5 minutes]
- Interstellar's rapidly spinning black hole was slowed down for aesthetic reasons during rendering, to reduce the resulting brightness asymmetry and blueshift.
- As we know, the arXiv surpassed $10^6$ papers last month and increased its article identifier sequence number to 5-digits to cope with the fact that they are nearing $10^4$ monthly submissions. Hot on arXiv's tail, now viXra has surpassed $10^4$ submissions! The real winner though is the snarxiv, with well over $\infty$ submissions...
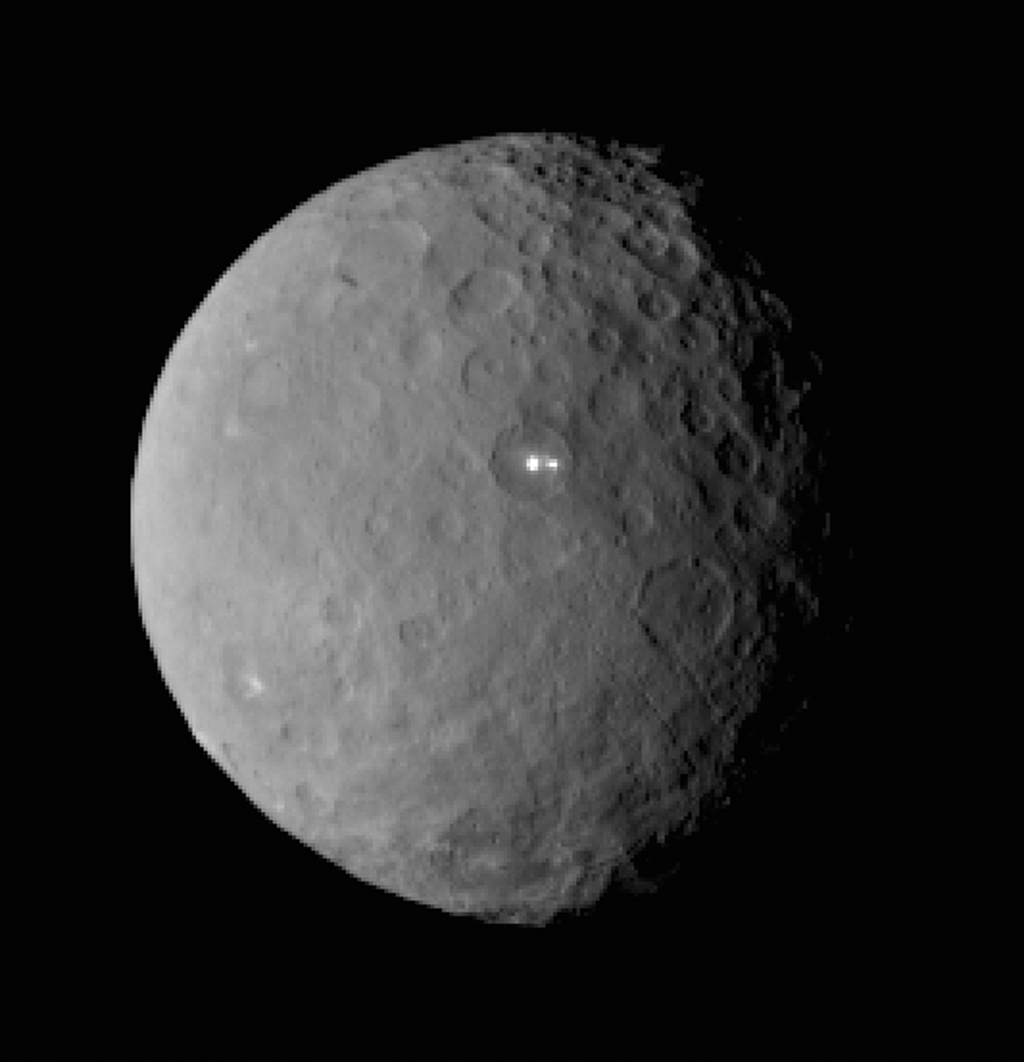
- The bright spot on Ceres is actually two bright spots! (Ceres is opening its other eye...)
- This week we won't end on space images. Instead I reproduce a poem by Thomas Otto called "LHC" (I enjoyed the final stanza):
I - LHC
Cold
Ice cold
Arctic cold
Nitrogen cold
Argon cold
Helium cold
Colder than the cosmos:
Superfluid Helium cold
In the cold,
Powerful currents
Engender magnetic forces
Ushering protons left and right.
Protons travelling on the crests of ethereal waves
Close to light speed
100 billion at a time, a galaxy of protons.
Wave after wave emerging from the cold
Spilling galaxies into the void
Galaxies of protons collide
To re-create the origins.
II - CMS
A cylinder from glass and steel,
A mythical animal hunched deep in its cave,
Swallowing bunches of protons,
Like a frog catching flies.
Protons colliding, the debris on paths bent by magnetic forces
Electrical signals through a network of cables
The animal’s thoughts light up,
A memory of the origins
III - CERN
Bright minds
Tackling tough problems:
Accuracy of the data,
Beauty of the theory,
And origins of the visible universe.
Seasoned researchers,
At ease with latest physical science:
Handling strings and triggers,
Seeing light in crystals,
And integrating over 26 hidden dimensions.
At lunchtime,
A challenge like no other:
Looking for a parking space,
Queuing for a menu,
And searching a place to put their meal tray.
 But it is a vector plot, so in principle it should be possible to extract the information on how to draw the curve. Here is one way...
 Now all you have to do is rescale your axes!


No comments:
Post a Comment